Mini Project 2
The power of a statistical test
The power of a statistical test is the probability that it rejects the null hypothesis when the null hypothesis is false. In other words, it’s the probability that a statistical test can detect when a true difference exists. The power depends on a number of factors. We will explore how the factors of variability in the data and size of the true difference in means effects the power curves.
Analysis
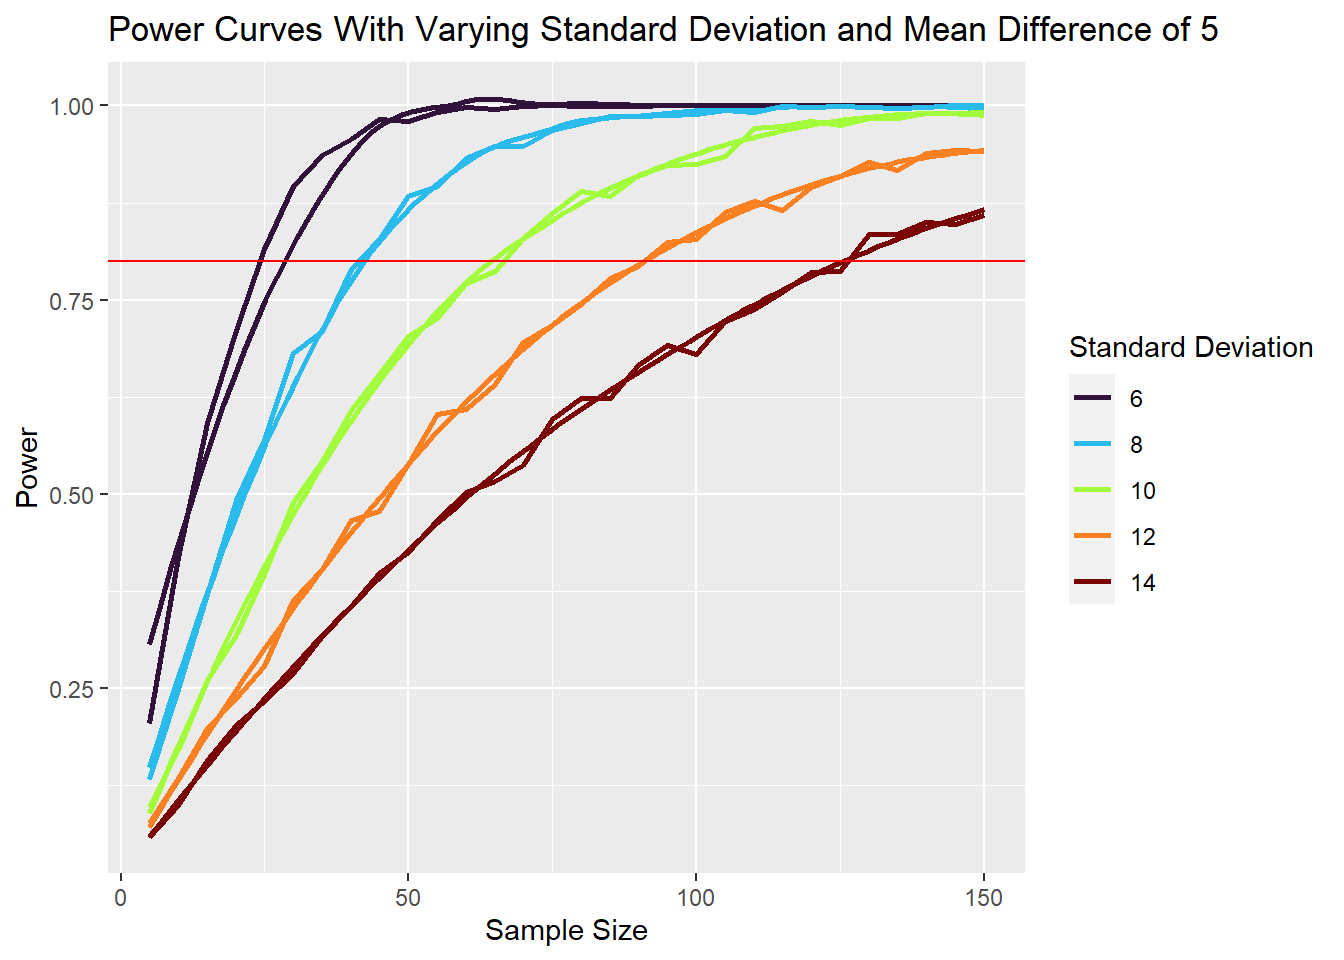
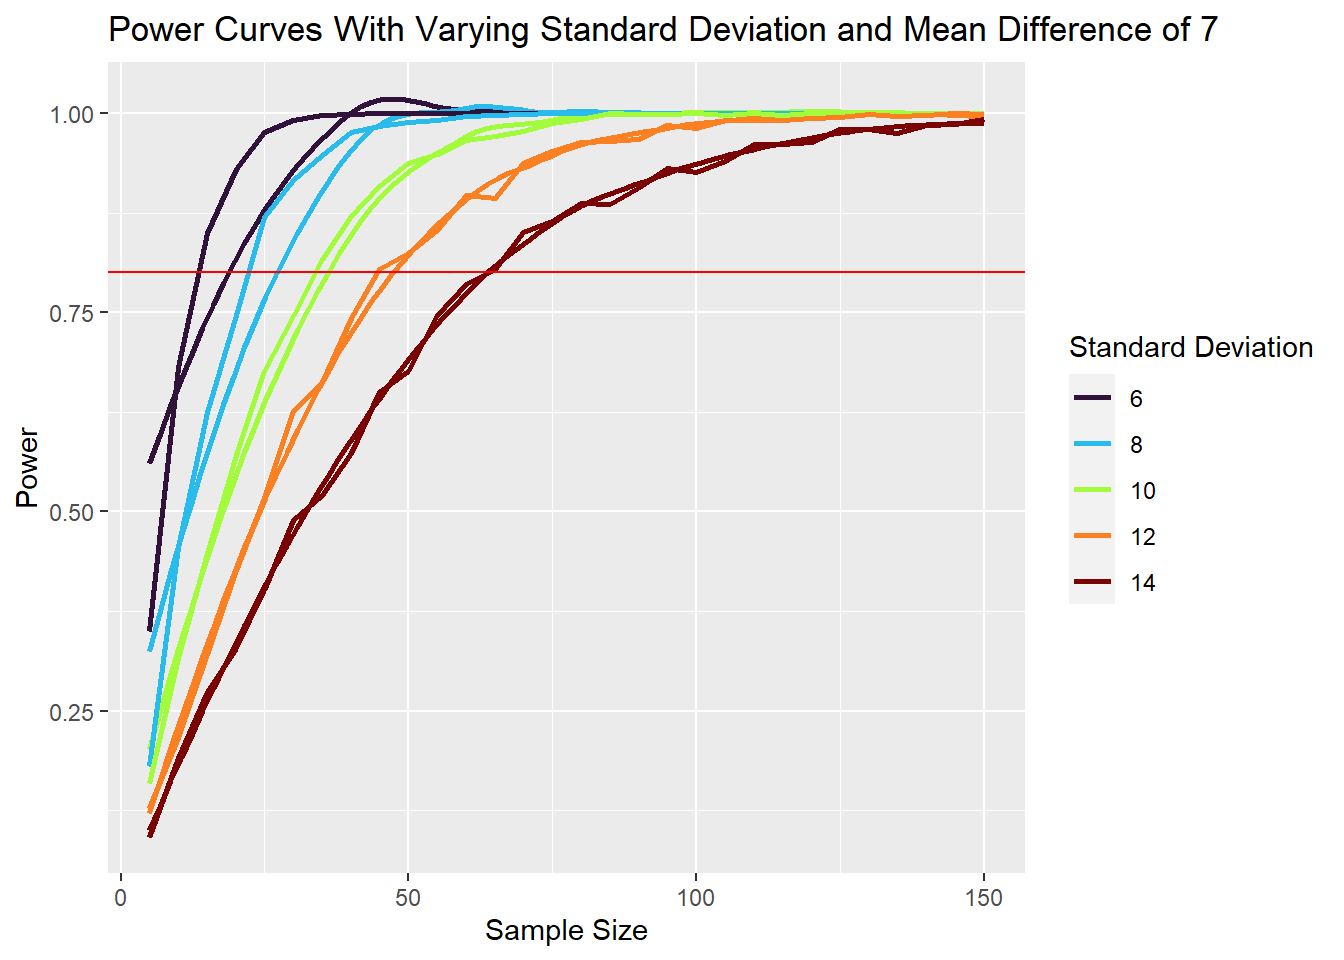
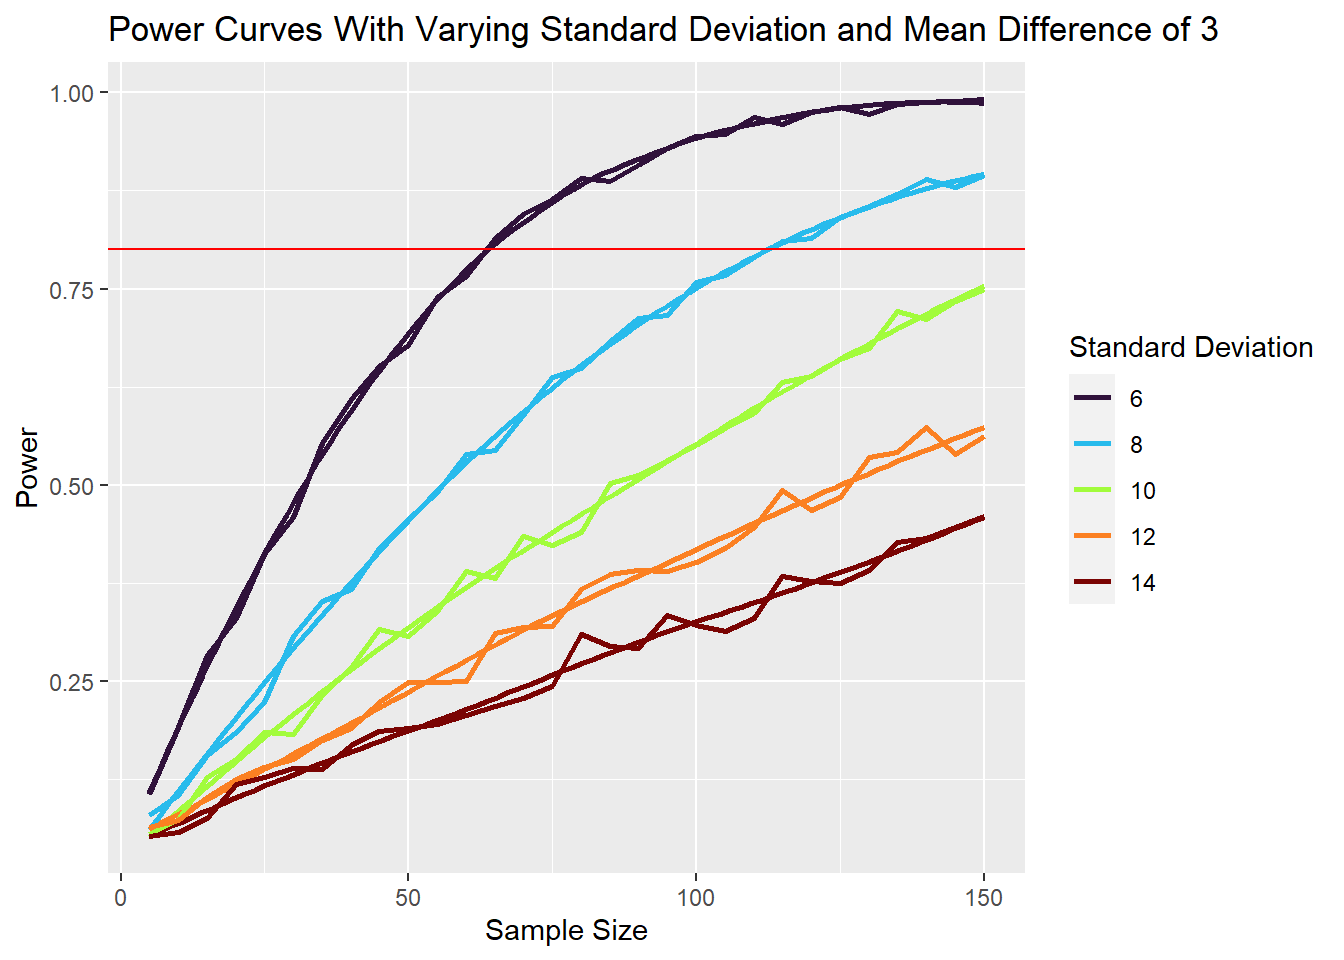
These three graphs use simulated data where the mean in one distribution is 100 and mean in the other is determined by the mean difference where the mean is the difference higher than 100 (so the second mean in these three graphs are 103, 105, and 107). All of these plots have five curves with standard deviation ranging from 6 to 14 by intervals of 2. Thre are two lines for each standard deviation in each plot where the ones that are jagged are created from the simulated observations and the smooth ones are the “lines of best fit”.
What we are looking for is how long it takes for these power curves to reach a power of 0.8 (ie. that the chance the simulated test can decect a significant difference is 80%). We are looking for this to see how big of a sample size we’d need in the real world for certain circumstances including the factors we are investigating.
It is evident from these plots that the higher the variability (standard deviation), the larger the required sample size is to prove a difference. This makes sense since it would probably be easier to prove a difference when things aren’t too different (variating) everytime you run the test.
It is also evident that a higher difference in means that a smaller sample size is needed to show a difference which is clear since the bigger the difference is the easier it should be to show that there is a difference.